MAP Violations
Overview
The MAP Violations tab shows Minimum Advertised Price (MAP) violations across platforms, sellers, and products in one place. It lets you filter data, review trends and KPIs, drill into row-level details, and take actions such as sending notices, pausing automation, escalating, or closing items.
How to view MAP violations
- Navigate to Price Monitor → MAP Violations.
- Verify the monitoring frequency shown at the top.
- Click the Filter icon to set seller status (Authorized, Unauthorized, All), Platform, Brand, Region, and product identifiers.
- Open the Date dropdown to select the time range (daily granularity; presets or custom up to 30 days).
- Switch between Trends, Seller, Platforms, and Products tabs to change the visualization.
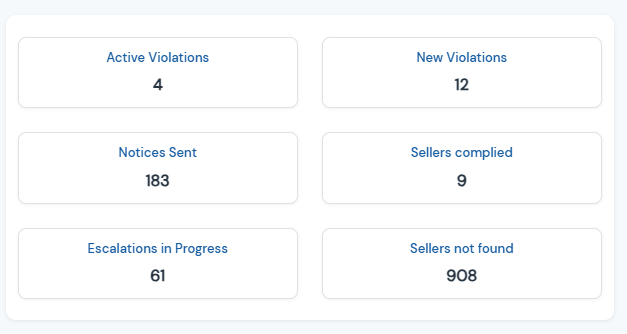
- Review the KPI cards on the right for Active Violations, New Violations, Notices Sent, Sellers Complied, Escalations in Progress, and Sellers Not Found.
- Scroll to the table to see violation details per seller × product × marketplace.
- Click Download to export filtered results.
- Click Settings to adjust violation thresholds, cadence, and sender mailbox.
The trends chart
- The chart shows Listings (bars), Violations (bars), and Compliance% (line).
- By default it loads 7 days, you can select up to 30 data points using the Date control.
- Use it to spot spikes in violations, track compliance over time, and gauge the effect of enforcement.
- Hover any bar or point to see exact values and dates.
- Use the chart menu to export the graphic (e.g., PNG, JPG, PDF).
The seller chart
- The chart lists sellers with their platform, listing counts, violation counts, and compliance%.
- Click a violation count to filter the table to affected rows for that seller.
- Review totals in the last row to understand overall exposure.
The platform chart
- The chart summarizes violations and listings by marketplace.
- Click a violation count to filter the table to that platform.
- Review totals in the last row to compare marketplaces.
The products chart
- The chart lists products with violation counts, listing counts, and compliance%.
- Click a metric to filter the table to that product scope.
- Review totals in the last row to understand product-level impact.

Use the KPI cards on the right to monitor focused counts while reviewing products.

How to view the details table
- The table shows violations at Seller × Product × Marketplace granularity.
- Click "Column" to select/deselect fields.
- Click Filter to refine by Current Status and Last Action.
- Current Status options: Still in Violation, Seller Not Found, MAP Compliant.
- Last Action options: Detected, 1st Notice Sent, 2nd Notice Sent, 3rd Notice Sent, Escalated.
- Click Done, then Save to apply filters.
- Review fields such as Current Price, Violation%, Violation Detection Date, Violation trend dots, Last Action, and more in the view details table.
- Click an ASIN to open the product PDP on the marketplace.
- Click the sparkline next to Current Price to open a price timeline.
- Choose a date range, hover for values to get exact details, export if needed.
- Click close to go back.
- Select rows using checkboxes to perform bulk actions.
- Use Bulk Action to Send Notice, Escalate, Pause Automation.
- Click Download to export the current, filtered dataset.

- If “Send Notice” is disabled on a row, automation is active, pause automation to switch to manual control.
- “Seller Not Found” indicates all scrapes that day returned no price.
- “Days in Violation (30D)” shows X/Y where X = distinct violating days and Y = distinct monitored days (excludes “Seller Not Found” days).
- Use Trends to identify spikes, then pivot to Seller or Platforms to focus enforcement, and use the table to act on specific rows.
Related Articles
How to view Brand Violations
Overview Brand Violations is available as part of the i2o Brand Protector subscription and can be accessed through the i2o application. This feature enables brands to monitor unauthorized sellers and identify potential violations that could impact ...The Reseller Spotlight
The Reseller Spotlight The Reseller Spotlight is a feature of the Brand Protector Benefits module. It allows brands to explore detailed information about 3P resellers including lost sales, reseller inventory, and other metrics that help brands ...Pricing
Overview Price Monitor gives advanced pricing intelligence across Amazon, Walmart, Target, iHerb + 150+ marketplaces. Track price drops, detect Buy Box losses, identify root causes, flag MAP violations, calculate revenue impact, and receive ...Brand Protector's Benefits
The Brand Protector Benefits module is activated as part of the i2o Brand Protection Solution and used for monitoring reseller enforcement actions. Metrics such as Lost Sales, Won Buy Box, and i2o Reseller Enforcement KPIs are visible in the Brand ...Glossary Of Terms & Metrics
# 1P: First Party, describes Amazon’s direct relationship with manufacturer brands and distributors that receive purchase orders from the retailer. Specific to Amazon's Vendor Central platform. 3P: Third-Party, describes sellers trading goods on ...